What happens to the temperature of a substance when it is heated or cooled? Many students think that temperature increases smoothly from solid to gaseous states but that is not the case.
Heating and cooling curves are often used to depict the temperature changes of substances as heat is added or removed over time.
These graphical representations illustrate how the temperature of a substance changes during heating or cooling processes while undergoing phase transitions, such as melting, boiling, and freezing.
The following are the heating and cooling curves of naphthalene:
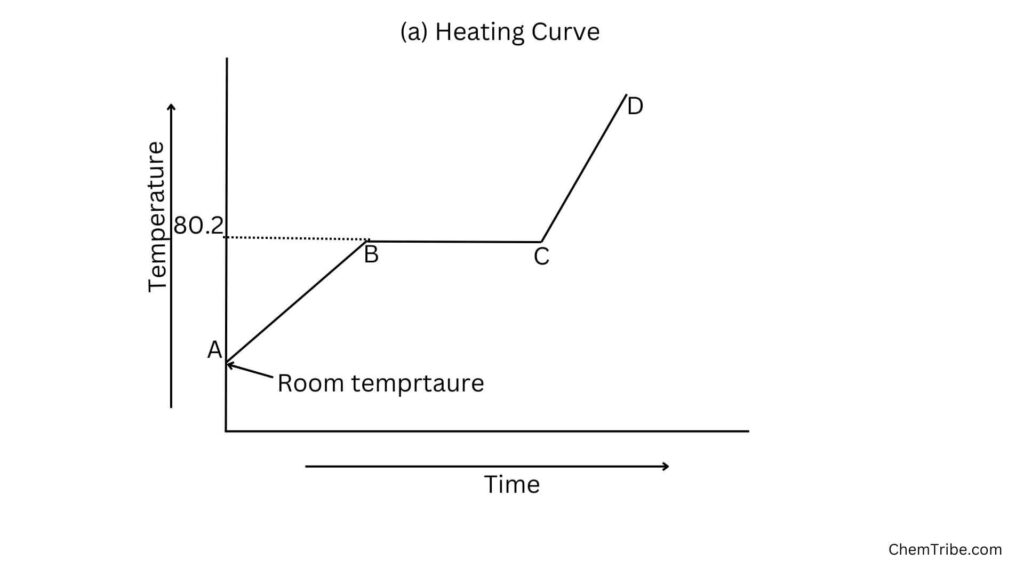
When naphthalene is heated, the temperature rises steadily until it starts to melt. At this point, the temperature remains constant until all the naphthalene has melted then the temperature starts rising again.
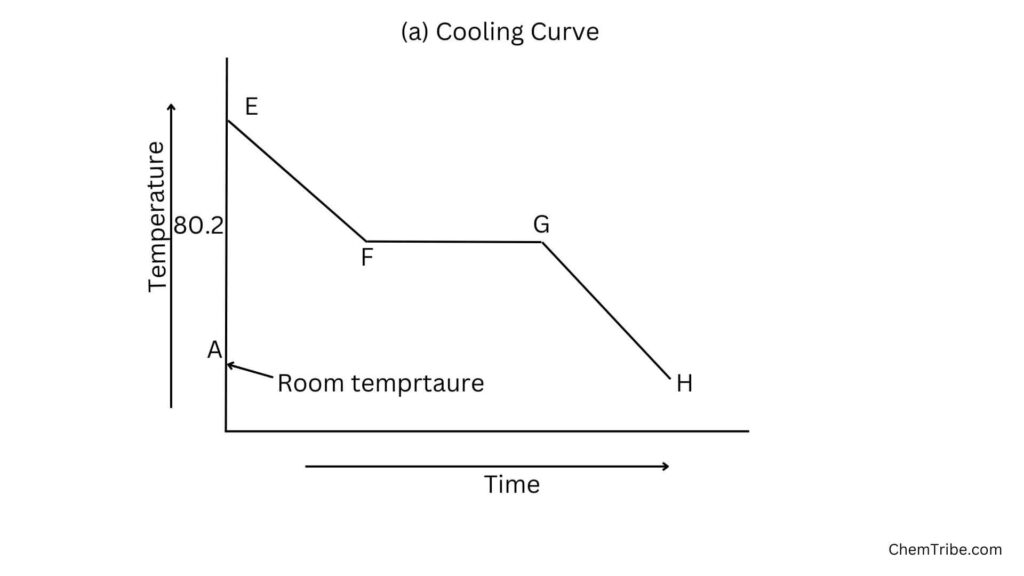
If liquid naphthalene is allowed to cool, the reverse can be obtained:
Explanation
On Heating
- Region AB: The temperature increases steadily as the naphthalene absorbs heat energy. The heat absorbed increases the kinetic energy of the particles and they vibrate more vigorously.
- Region BC: the temperature remains constant until all the naphthalene melts. At this stage, the heat supplied is used to weaken the forces of attraction holding the particles of naphthalene together rather than increase the temperature. As a result, the particles move far apart. Naphthalene’s state changes from solid to liquid.
- Region CD: Temperature rises steadily as the liquid naphthalene absorbs heat energy. The heat supplied at this stage increases the kinetic energy of the particles, making them to move fast.
On cooling
- Region EF: As heat is removed from naphthalene, its temperature decreases steadily until it reaches the condensation point.
- Region FG: At the condensation point, the temperature remains constant as naphthalene undergoes a phase transition. During this phase transition, the removed heat is used to form intermolecular forces rather than decrease the temperature.
- Region GH: Once the phase transition is complete, the temperature continues to decrease until it reaches the next phase transition or the minimum temperature desired.
Heating and Cooling Curves of Water
To further understand the behavior of substances as they transition from transition from solid to liquid to gaseous states, let’s take a look at the heating and cooling curves of water:
Heating
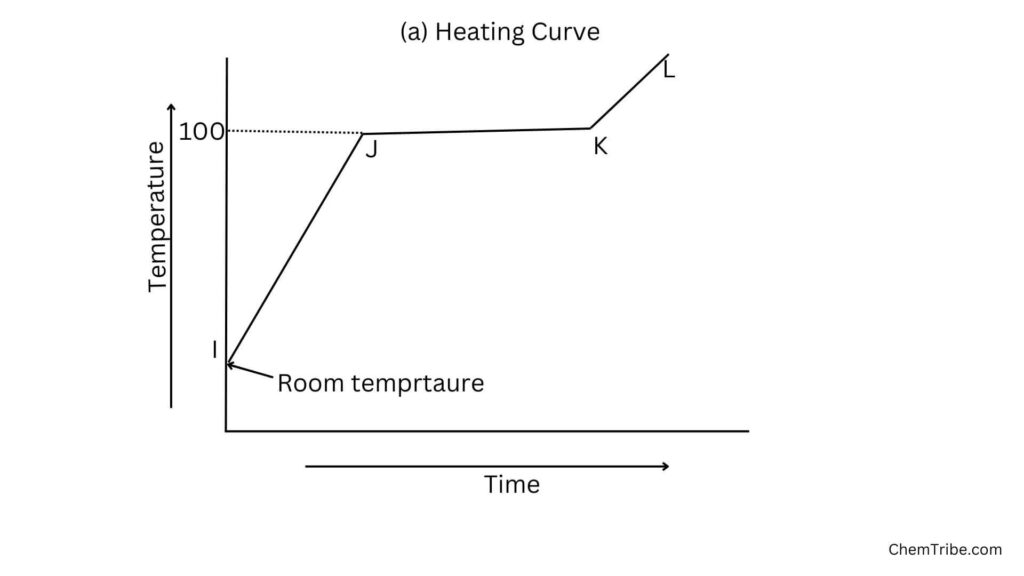
- When water is heated, its temperature steadily increases (Region IJ) as molecules absorb heat energy, which increases their kinetic energy. The temperature of the water continues to rise until the water starts to boil (Region J).
- The temperature of the water remains constant as it boils (Region JK). This is because the heat energy supplied is used to break the forces of attraction holding the particles together. As a result, some particles break free and the water changes from liquid to gaseous state (Region KL).
Cooling
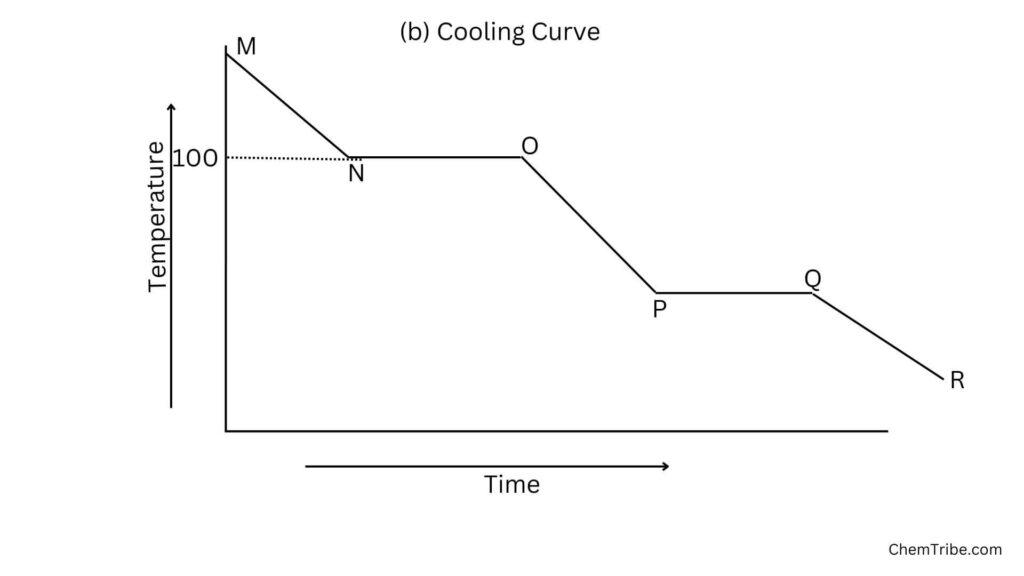
- As heat is removed from steam (above 100°C), its temperature decreases until it reaches the boiling point (Region N). At this point, the temperature remains constant as the steam condenses into liquid water (Region NO). This plateau represents the heat released during the phase change from gas to liquid.
- Once all the steam has condensed, the temperature of the water begins to decrease until it reaches the freezing point (Region P). At the freezing point, the temperature remains constant as the liquid water freezes into ice (Region PQ). This plateau represents the heat released during the phase change from liquid to solid.
- Beyond the freezing point (Region QR), if the heat continues to be removed (water is cooled further), the temperature of the ice decreases further.
Heating and cooling curves provide valuable information about the thermal behavior and phase changes of substances as they transition from solid to liquid, to gaseous states and vice versa.


